
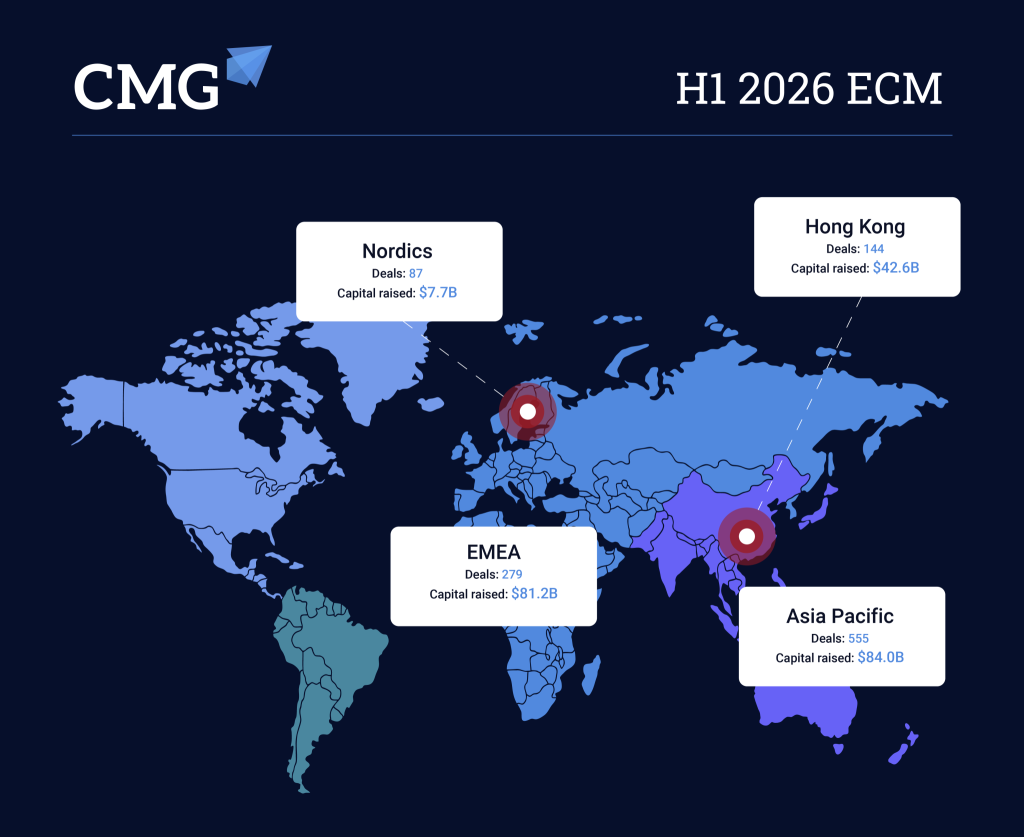
H1 2026 was a strong half for global equity capital markets, delivering a wave of high-profile offerings that reinvigorated issuer and investor confidence alike.
From a record-breaking week of IPOs in Hong Kong to the largest secondary offering ever priced in Greece, activity was strong across the board, even as regions diverged in where that growth came from.
For more key data points and trends that defined the first half of the year, download CMG’s H1 2026 Global ECM Recap.
Key Takeaways
Global ECM activity strengthened across nearly every region in H1 2026, but the drivers varied widely: a tech-led IPO boom in Hong Kong, a return to form for large secondaries in EMEA and a more selective, smaller-deal environment in the Nordics.
Notably, the regions with the strongest returns (Hong Kong, APAC) weren’t necessarily the ones with the strongest volume growth (EMEA). It serves as a reminder that a hot aftermarket and a hot issuance calendar don’t always move together.
Here’s a detailed breakdown of how APAC, Hong Kong, EMEA and the Nordics each shaped up in the first half of the year.
APAC
555 deals • $84.0bn raised
APAC saw 555 deals raising $84.0B in H1 2026, the most prolific first half for capital raised in the region since 2021.
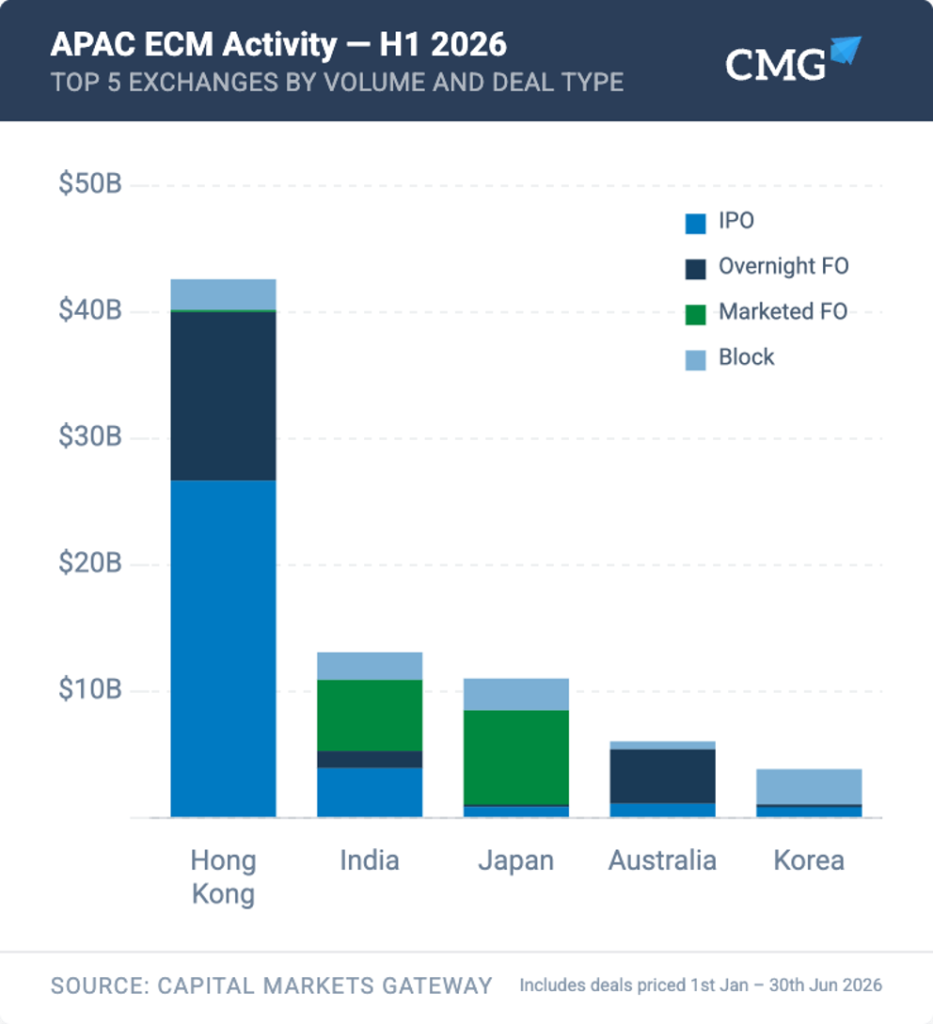
- Largest deal: Contemporary Amperex Technology (CATL), raising $5.0B overnight follow-on in Hong Kong
- Largest IPO: Victory Giant Technology raised $3.0B in Hong Kong
Hong Kong
144 deals • $42.6bn raised
Hong Kong was the standout story within APAC, posting its most active half for capital raising since H1 2021.
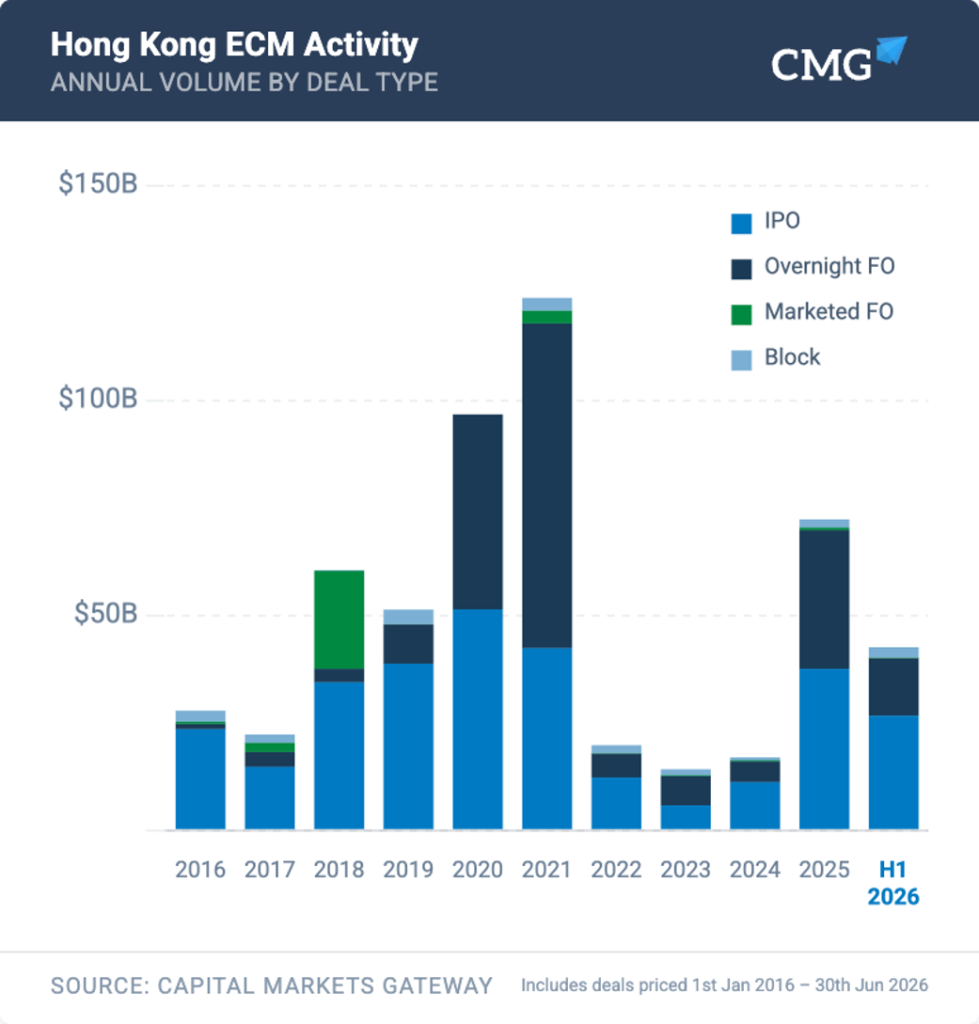
- Largest deal: Contemporary Amperex Technology (CATL) raised $5.0B in an overnight follow-on
- Largest IPO: Victory Giant Technology raised $3.0B. Victory Giant Technology returned +50.1% offer-to-first-day, one of the largest dollar-weighted alpha contributors globally in H1
EMEA
279 deals • $81.2bn raised
EMEA saw its most active half for capital raising since H1 2021.
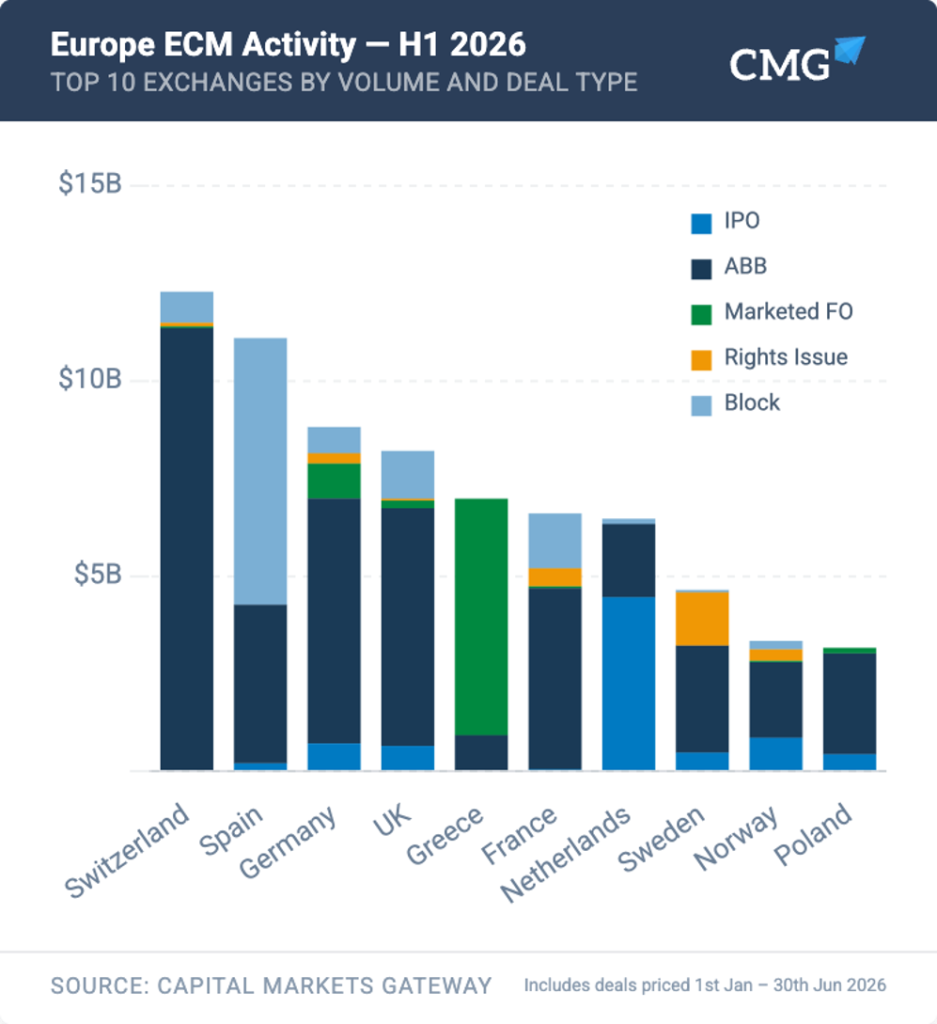
- Largest deal: Galderma raised $6.3B in a 100% secondary ABB in Zurich, delivering a full exit for an EQT-led consortium.
- Another notable large deal was Public Power Corp’s $4.9B marketed follow-on in Athens, cornerstoned by the Greek government and CVC Partners, which is the largest deal ever completed in the Greek market
- Largest IPO: CSG raised $4.5B in Amsterdam
EMEA’s growth this half was overwhelmingly a secondaries story. Galderma’s fully secondary ABB and PPC’s marketed follow-on were both among the largest deals in the region.
That’s notable against a broader global shift in how secondary structures performed: underwritten registered directs swung from -4.1% in FY25 to +9.6% in H1 2026, one of the sharpest reversals in the data, while registered blocks moved the opposite direction. EMEA’s large-cap secondaries appear to have found a market that was newly receptive to this kind of structure.
Nordics
87 deals • $7.7bn raised
The Nordics posted solid year-on-year growth, though activity cooled slightly versus H2 2025.
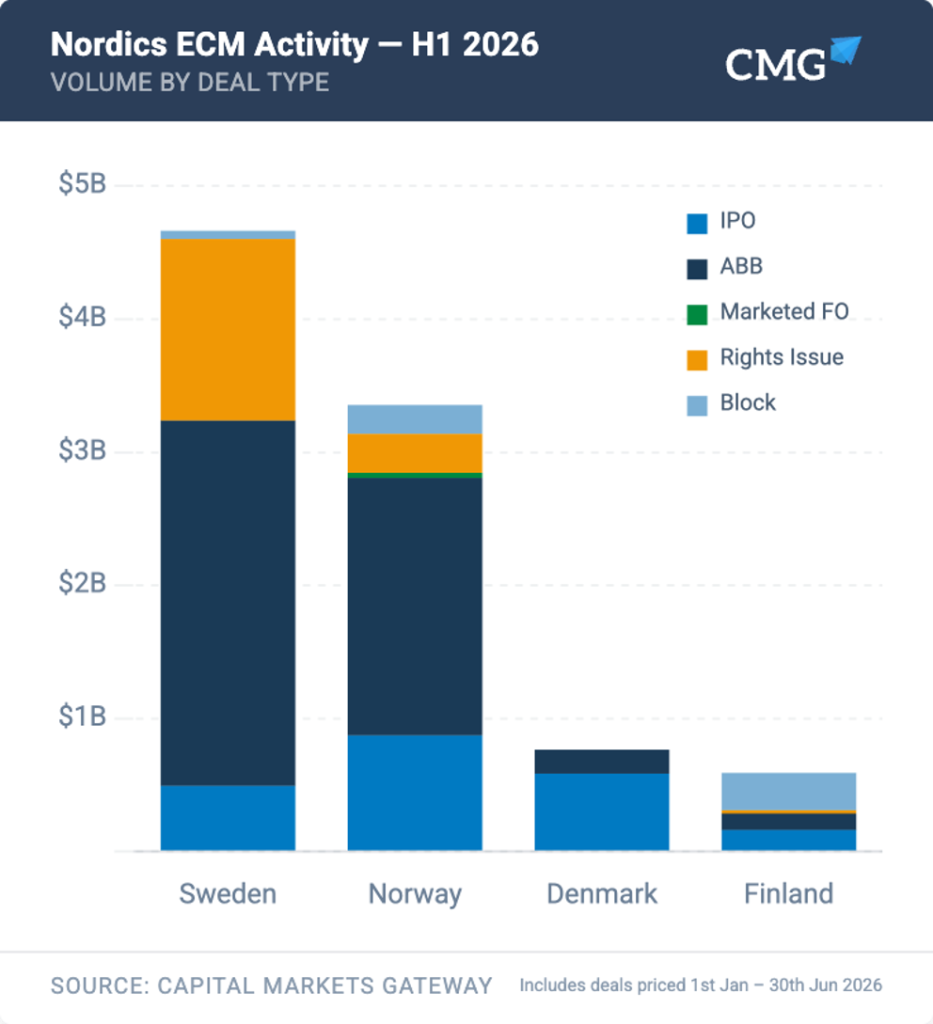
- Largest deal: Electrolux’s $943.9m rights issue raised $943.9m in Stockholm
- Largest IPO: Capital Tankers raised $492.5m in Oslo
As the second half of the year gets underway, the key question is whether this momentum holds, particularly for IPO markets that have driven so much of the year’s growth so far.
